tausurv
Survival analysis for Python: nonparametric estimators, regression models, tree ensembles and neural networks behind one interface, with support for competing risks.
A Kaplan-Meier curve with a 95% confidence band and an at-risk table, on the Mayo Clinic PBC trial:
import tausurv as ts
ts.plot.set_style("publication")X, Y, delta = ts.datasets.load_pbc()ts.plot.km(Y / 365.25, delta, xlabel="years from registration")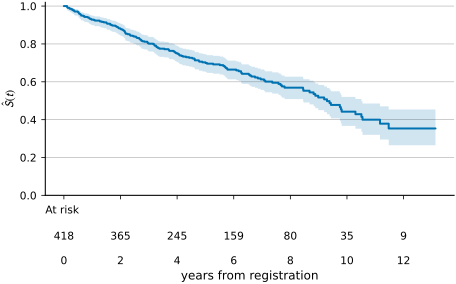
Contents of the package
Section titled “Contents of the package”| subpackage | contents |
|---|---|
ts.nonparametric | Kaplan-Meier, Nelson-Aalen, Aalen-Johansen, censoring distribution |
ts.linear | Cox proportional hazards, Weibull, log-normal and log-logistic AFT, Fine-Gray |
ts.trees | survival tree, random survival forest, gradient boosting |
ts.nn | DeepSurv, DeepHit, logistic hazard, deep survival machines, CopulaSurv, HACSurv |
ts.metrics | concordance, time-dependent AUC, Brier score, calibration, with cause-specific variants |
ts.model_selection | cross-validation, hyperparameter search, nested cross-validation |
ts.datasets | 100 survival tables from 68 studies, downloaded on first use and checksummed |
ts.simulations | single-risk and competing-risks data with known truth |
ts.plot | survival and incidence curves, forest plots, calibration, metrics over time, SHAP |
Every fitted model exposes the same prediction methods: survival function, cumulative hazard, cumulative incidence, restricted mean survival time and a risk score.
Documentation
Section titled “Documentation”- Tutorials work through an analysis of the PBC trial: Kaplan-Meier curves, a Cox model with held-out evaluation, and competing risks.
- How-to guides solve one task each.
- Concepts explain the quantities and assumptions behind the methods.
- Plotting covers the plot functions and styles.
- API reference is generated from the docstrings.